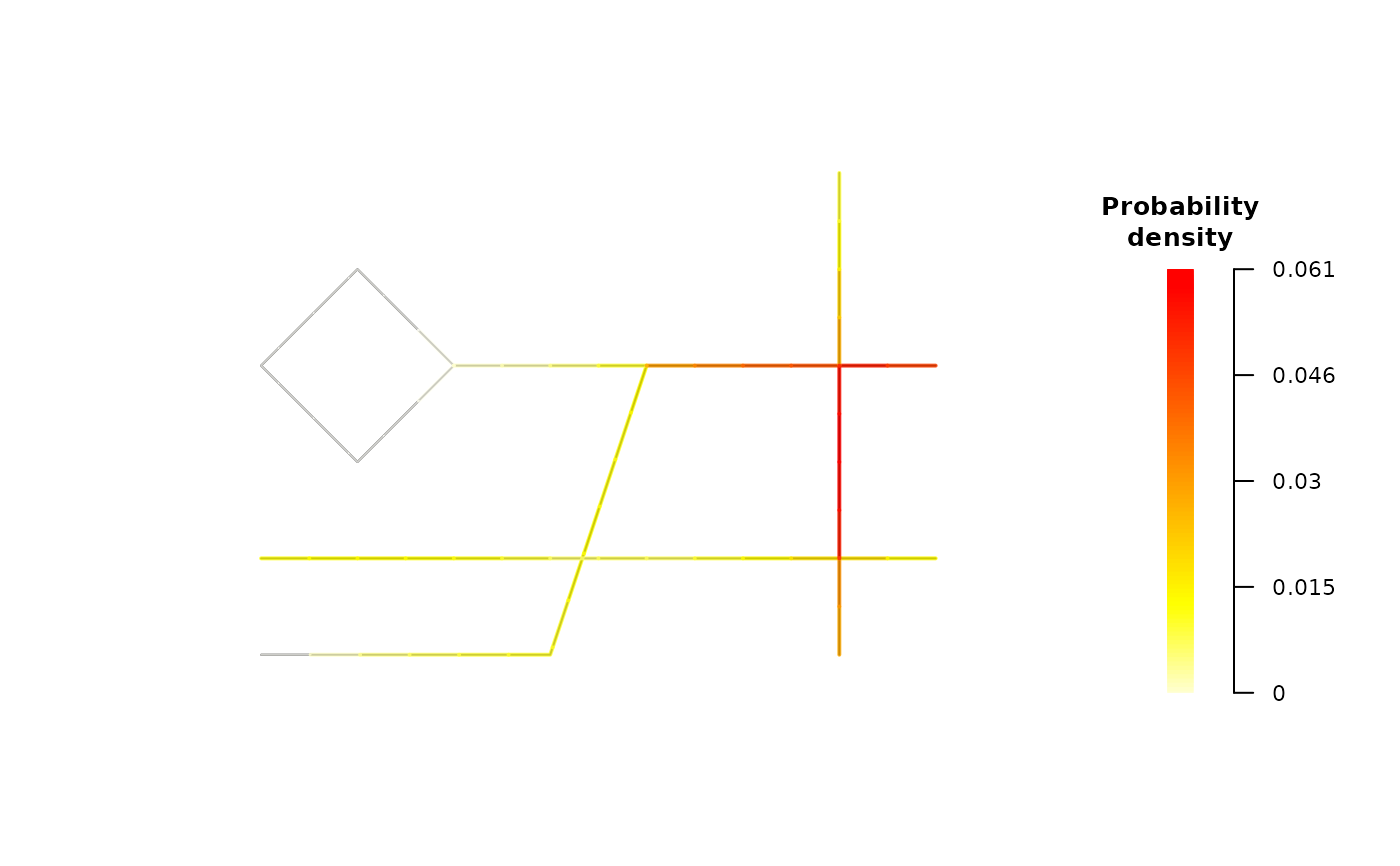
Convolute segmented road network
Source:R/convolute-segmented-network.R
convolute_segmented_network.RdThis function convolves a segmented network using a specified kernel function, typically for traffic modeling or network analysis. It computes weights densities based on the distance between links in the network and the number of events assigned to each link. Optionally, it can adjust for branching in the network.
Usage
convolute_segmented_network(
  segmented_network,
  kernel = compute_epanechnikov,
  bandwidth = 3,
  use_esd = TRUE,
  correct_boundary_effects = TRUE,
  ...
)
Arguments
- segmented_network
A
segmented_networkobject assigned with events.- kernel
A kernel function to use for convolution (default is Epanechnikov kernel).
- bandwidth
Numeric value representing the bandwidth for the kernel function (default is 3).
- use_esd
If
TRUE, considers branching in the kernel using the Equal Split Discontinous kernel (ESD). ESD follows the method described in Okabe et al., accounting for road intersections and ensuring that kernel weights are correctly distributed across accross branches (default isTRUE).- correct_boundary_effects
If
TRUE, corrects for boundary effects by normalizing the kernel weights to account for kernel values outside the network (default isTRUE).- ...
Additional arguments passed to the kernel function.
References
Okabe, A., Satoh, T., & Sugihara, K. (2009). A kernel density estimation method for networks, its computational method and a GIS-based tool. International Journal of Geographical Information Science, 23(1), 7-32. doi:10.1080/13658810802475491
Examples
# Create a road network
road_network <- create_road_network(sample_roads)

# Assign sample accidents data
road_network <- set_events(road_network, sample_accidents)

# Segment the road network
segmented_network <- create_segmented_network(
  road_network,
  segment_length = 0.5
)

# Check the segmented road network after assigning events
segmented_network
#> Segmented network
#> Segment length:  0.5
#> Segments:
#>            id        from          to parent_link parent_road count density
#> 1 sl_00000001 sn_00000001 sn_00000004   lk_000001     rd_0001     0       0
#> 2 sl_00000002 sn_00000004 sn_00000005   lk_000001     rd_0001     0       0
#> 3 sl_00000003 sn_00000005 sn_00000006   lk_000001     rd_0001     0       0
#> 4 sl_00000004 sn_00000006 sn_00000007   lk_000001     rd_0001     0       0
#> 5 sl_00000005 sn_00000007 sn_00000008   lk_000001     rd_0001     0       0
#>                         geometry
#> 1  LINESTRING (0 0, 0.5135231 0)
#> 2 LINESTRING (0.5135231 0, 1....
#> 3 LINESTRING (1.027046 0, 1.5...
#> 4 LINESTRING (1.540569 0, 2.0...
#> 5 LINESTRING (2.054093 0, 2.5...
#> ... 52 more segments
#> Events:
#>        id time weather severity        geometry
#> 1 ac_0001   18   Sunny    Minor     POINT (1 1)
#> 2 ac_0002    4   Foggy    Fatal POINT (3.2 0.4)
#> 3 ac_0003   13   Snowy    Minor POINT (4.1 3.1)
#> 4 ac_0004   23   Sunny    Minor POINT (5.7 3.1)
#> 5 ac_0005    7   Rainy    Minor POINT (5.9 1.1)
#> ... 52 more events

# Apply the convolution to calculate link densities using
# the kernel function
convoluted_network <- convolute_segmented_network(segmented_network)

# Check the convoluted network with the computed densities
convoluted_network
#> Segmented network
#> Segment length:  0.5
#> Segments:
#>            id        from          to parent_link parent_road count     density
#> 1 sl_00000001 sn_00000001 sn_00000004   lk_000001     rd_0001     0 0.000000000
#> 2 sl_00000002 sn_00000004 sn_00000005   lk_000001     rd_0001     0 0.003439447
#> 3 sl_00000003 sn_00000005 sn_00000006   lk_000001     rd_0001     0 0.006830324
#> 4 sl_00000004 sn_00000006 sn_00000007   lk_000001     rd_0001     0 0.009467673
#> 5 sl_00000005 sn_00000007 sn_00000008   lk_000001     rd_0001     0 0.011351494
#>                         geometry
#> 1  LINESTRING (0 0, 0.5135231 0)
#> 2 LINESTRING (0.5135231 0, 1....
#> 3 LINESTRING (1.027046 0, 1.5...
#> 4 LINESTRING (1.540569 0, 2.0...
#> 5 LINESTRING (2.054093 0, 2.5...
#> ... 52 more segments
#> Events:
#>        id time weather severity        geometry
#> 1 ac_0001   18   Sunny    Minor     POINT (1 1)
#> 2 ac_0002    4   Foggy    Fatal POINT (3.2 0.4)
#> 3 ac_0003   13   Snowy    Minor POINT (4.1 3.1)
#> 4 ac_0004   23   Sunny    Minor POINT (5.7 3.1)
#> 5 ac_0005    7   Rainy    Minor POINT (5.9 1.1)
#> ... 52 more events

# Plot the convoluted network showing the density distribution
plot(convoluted_network, mode = "density")
