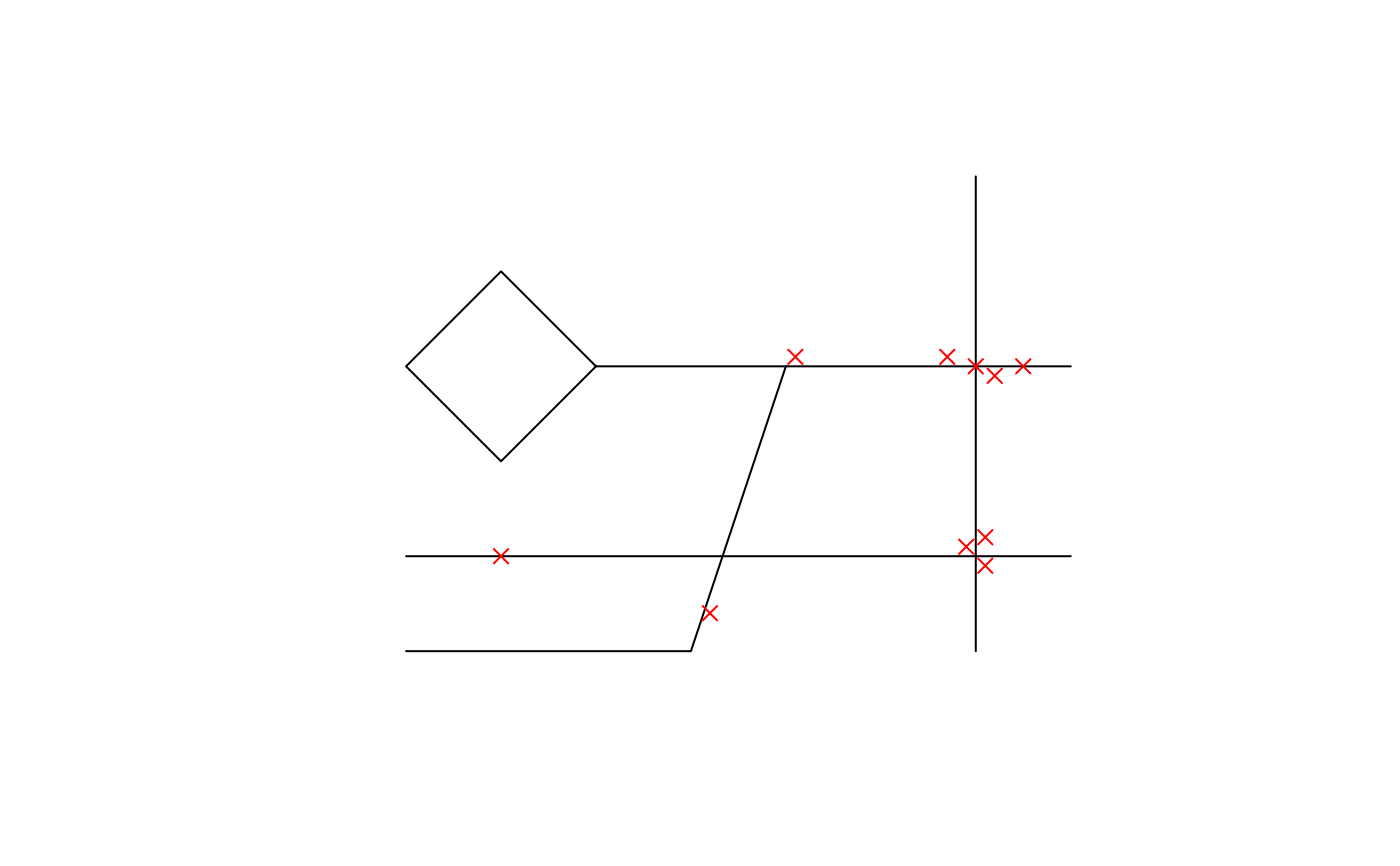
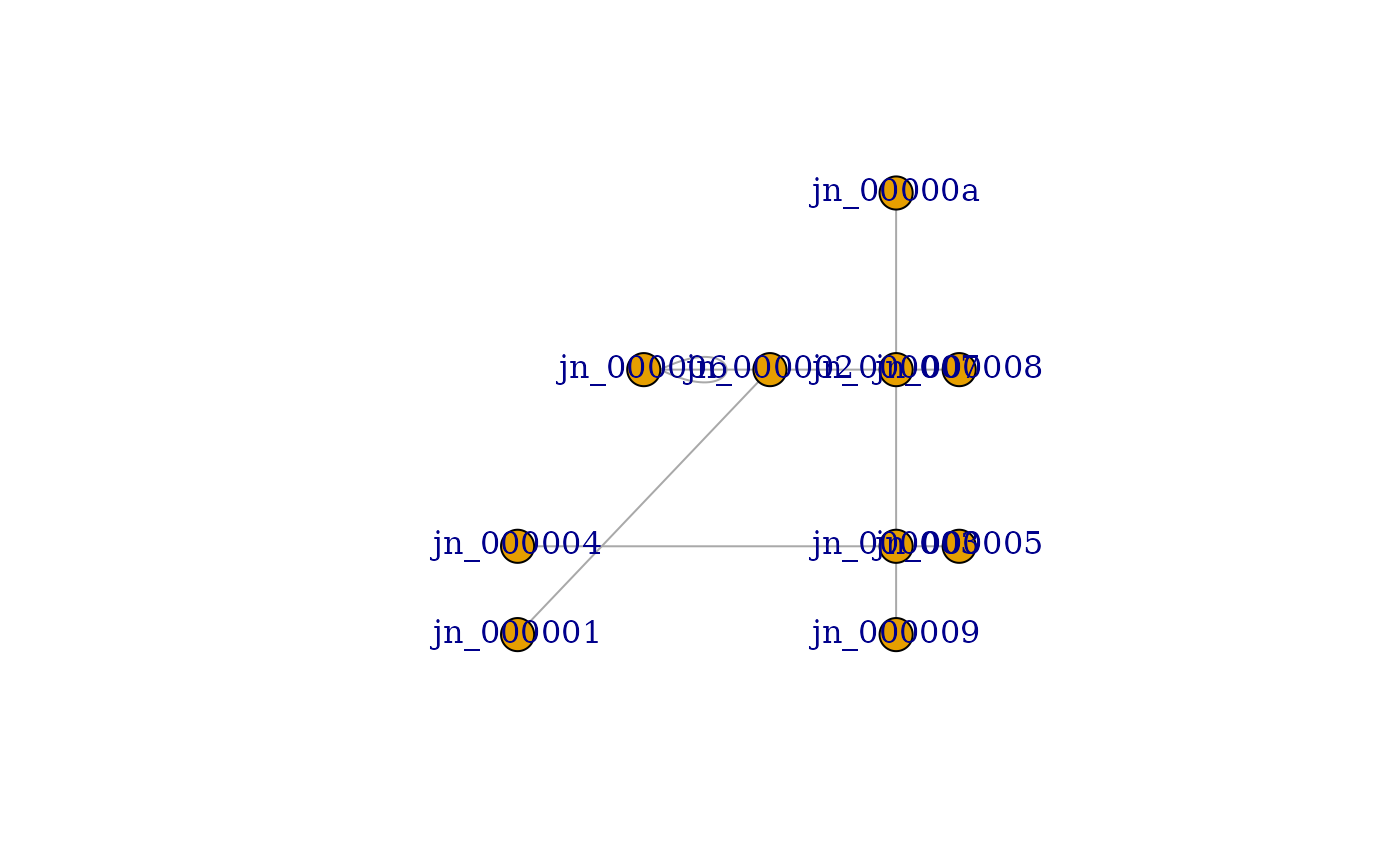
This function plots a road network.
Arguments
- x
A road network object.
- y
This argument is not used.
- mode
The plotting mode. "event" mode shows the location events assigned to the road network. "graph" mode shows the direction of links when the network is directed. This utilizes the
plot.igraphfunction.- ...
Additional arguments passed to or from other methods.
Examples
# Create the road network
road_network <- create_road_network(sample_roads, events = sample_accidents)

# Plot the road network
plot(road_network)


# Plot the road network with events
plot(road_network, mode = "event")


# Plot the road network as a graph
plot(road_network, mode = "graph")

