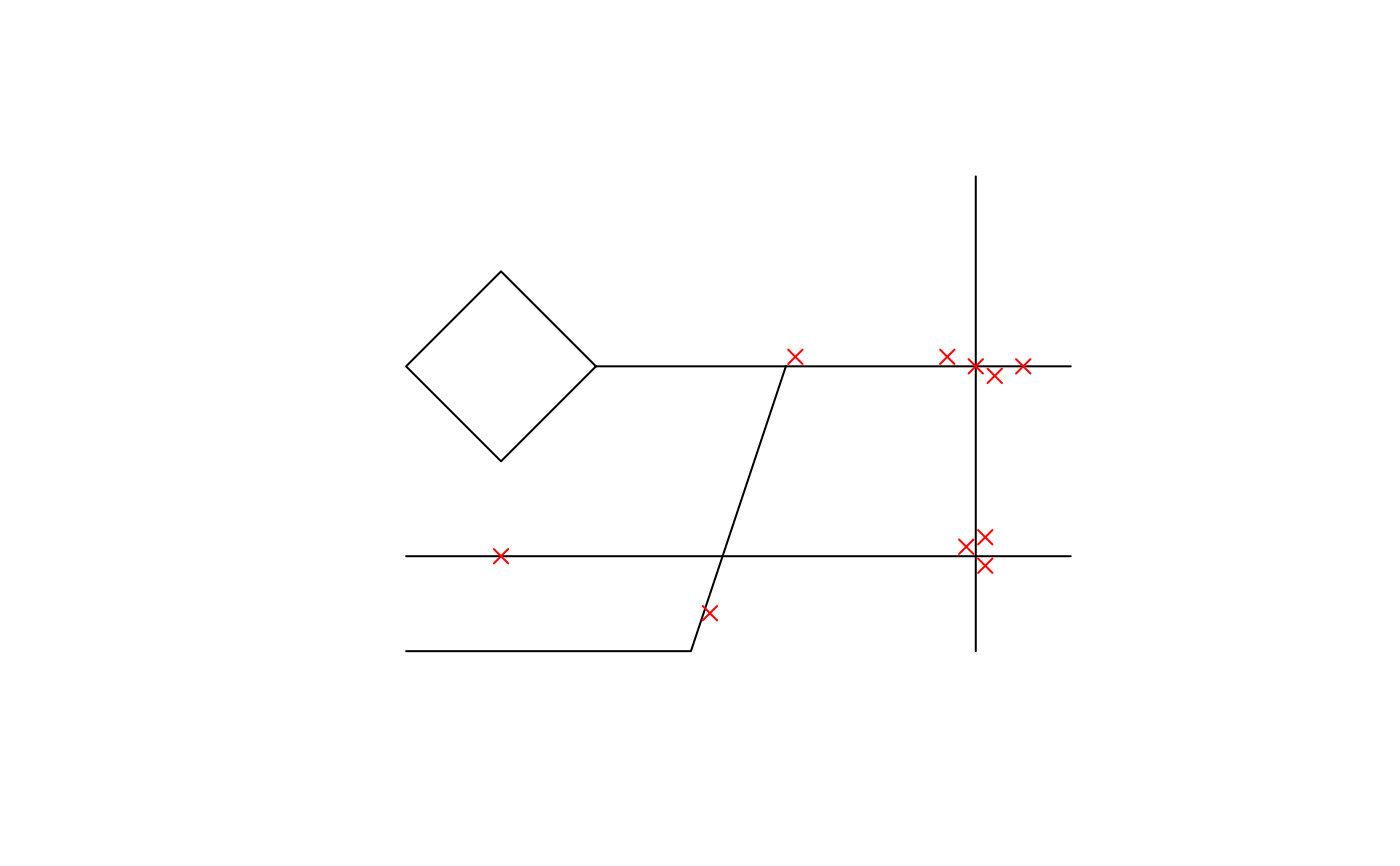
A sample dataset containing information about 10 accidents. The dataset is for demonstration and testing and does not represent real-world events.
Format
A sf object with 10 rows and 4 columns:
- id
Accident ID
- time
Time of the accident (in hours)
- weather
Weather condition at the time of the accident
- severity
Severity of the accident
- geometry
Point geometry of the accident location
Examples
# Show information about the accidents
sample_accidents
#> Simple feature collection with 10 features and 4 fields
#> Geometry type: POINT
#> Dimension:     XY
#> Bounding box:  xmin: 1 ymin: 0.4 xmax: 6.5 ymax: 3.1
#> CRS:           NA
#>         id time weather severity        geometry
#> 1  ac_0001   18   Sunny    Minor     POINT (1 1)
#> 2  ac_0002    4   Foggy    Fatal POINT (3.2 0.4)
#> 3  ac_0003   13   Snowy    Minor POINT (4.1 3.1)
#> 4  ac_0004   23   Sunny    Minor POINT (5.7 3.1)
#> 5  ac_0005    7   Rainy    Minor POINT (5.9 1.1)
#> 6  ac_0006    7   Sunny    Minor     POINT (6 3)
#> 7  ac_0007   19  Cloudy    Minor POINT (6.1 0.9)
#> 8  ac_0008    8   Sunny    Minor POINT (6.1 1.2)
#> 9  ac_0009   19   Rainy  Serious POINT (6.2 2.9)
#> 10 ac_000a   20   Sunny    Minor   POINT (6.5 3)

# Plot the locations of the accidents
plot(sample_roads$geometry)
plot(sample_accidents$geometry, pch = 4, col = "red", add = TRUE)

